
The top data visualization trends on Workvix.com to make your business more successful.
In the modern digitalized and busy world, businesses create big data in the form of gigas of information per second. Raw data is meaningless though unless it is converted into intelligible and actionable information. That is why the data visualization trends have become essential to contemporary organizations, which want to comprehend their data, make informed decisions, and be ahead of their rivals.
We are Workvix.com and we transform data and turn it into meaningful and interactive visual experiences allowing teams to take action. Staying abreast of the current data visualization trends can provide your company with a competitive advantage, improve workflows, and decision-making processes.
This is a comprehensive guide on seven data visualization trends, that have been game changers in the business world, and demonstrate how Workvix.com assists you in capitalizing on them.
Live Dashboards to make an immediate decision.
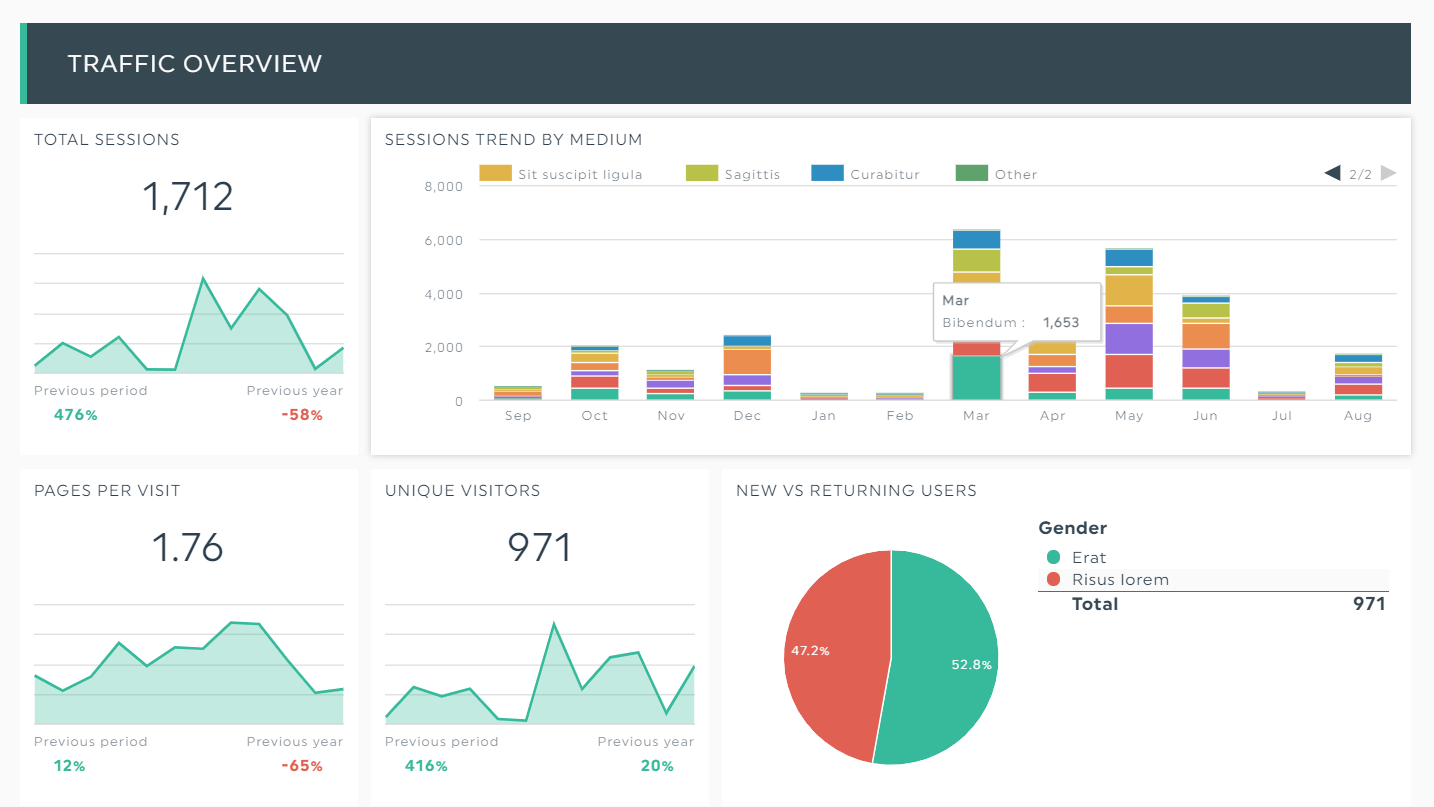
The use of real-time dashboards is one of the most important trends in data visualization that influences the industry. It is no longer necessary to wait till the end of the week or month to analyse performance. Business entities have become insistent on receiving the KPIs in real time.
Real-time dashboard extracts information across various sources and shows it in a single centralized window so that managers can make fast and informed decisions. At Workvix.com, there are customizable dashboards, which update automatically and in real time, allowing you to identify issues early, react fast, and remain agile in the competitive market.
Artificial Intelligence-Powered Insights and Predictive analytics.
AI is transforming the data analysis landscape of businesses. The other significant trend in data visualization is the implementation of AI and machine learning on dashboards and analytics tools.
AI-driven visualizations automatically discover patterns, uncover anomalies, and create predictive insights do not require as much manual analysis. It will also allow decision makers to concentrate on strategic moves and not on crunching numbers.
AI-driven tools in Workvix.com make your visualizations smart and allow you to predict the behavior of customers, optimize inventory, and predict sales with amazing precision.
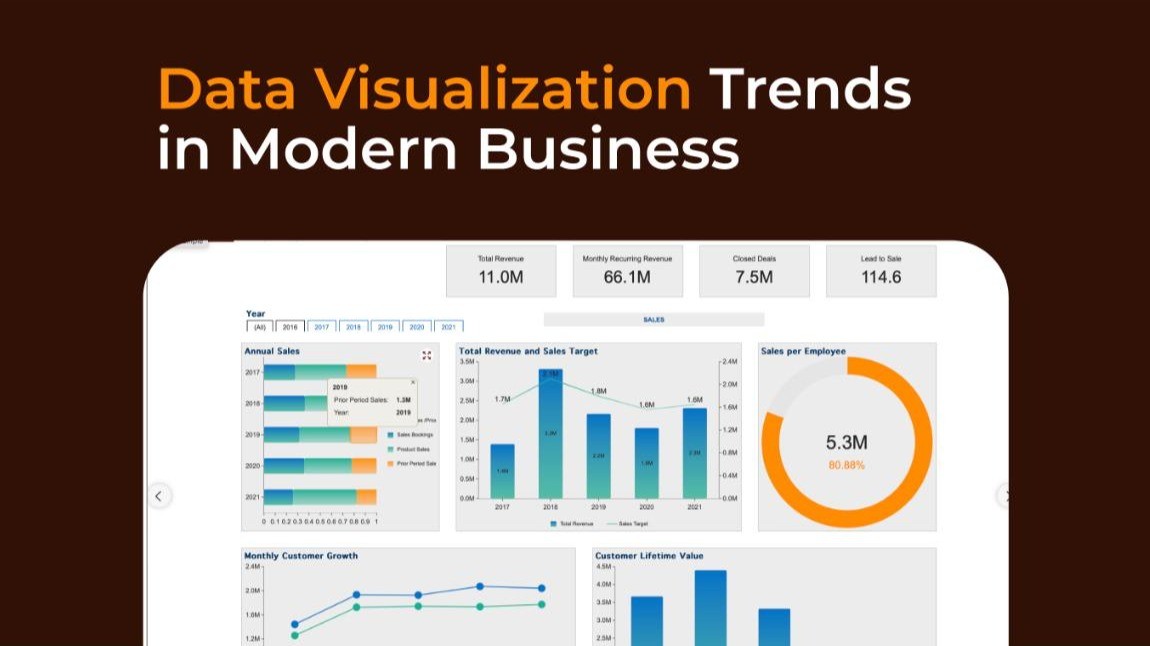
On-the-Go Mobile Visualization.
Mobile-friendly dashboards are becoming an essential trend of data visualization as the number of professionals who work remotely or travel often increases. Decision-makers should be able to access the insights wherever they are.
Mobile-first will make your charts, graphs and dashboards completely responsive and simple to read on any device. Workvix.com develops responsive solutions, which fit perfectly on tablets and smartphones to ensure that your teams are updated and productive wherever they go.
Story-driven and interactive Dashboards.
Dynamism Static charts are rapidly being phased out. A trend in data visualization that is one of the most thrilling is that of interactivity and data storytelling. Interactive dashboards enable the user to filter, drilldown and view datasets in a variety of ways resulting in greater insights.
Story based dashboards are visualizations that are accompanied with context so that the stakeholders can see not only the figures, but also the story behind them. We make beautiful dashboards that visualize the story of your data in a way that is compelling and easy to understand at Workvix.com.
Self-Service BI Augmented Analytics.
Augmented analytics is another strong data visualization trend, which enables non-technical users to explore data on their own. Using natural language query, language users are able to ask questions and then immediately view visual results.
This data democratization lowers the use of IT departments and also enables all the employees to make decisions based on data. Workvix.com incorporates the capabilities of augmented analytics on its platforms, which enables your teams to own their insights without technical limitations.
Data Visualization on the Cloud to Scale.
Businesses increase in size, and so does its data. Cloud-based solutions have emerged as one of the most important data visualization trends as they are scalable, flexible, and accessible.
The dashboards based on cloud computing allow teams situated in various sites to work together instantly and view data safely. Workvix.com offers powerful cloud-based visualization to make sure that whatever the team is doing, your data is up to date and accessible wherever you have to work.
Data Governance and Data Security BI.
Security dashboards have become a necessity with the growing value of data privacy. The new trend in data visualization assists businesses to monitor the compliance metrics, security breach, and data utilization.
The data governance visualization layer will help the leadership stay up-to-date on the risks identified and maintain regulatory compliance. Workvix.com cares about security visualization, which businesses can be sure that their data is not just actionable, but secure.